The Overview
The Overview shows what a run did, on one page: why the spec exists, how long each phase took, what was checked, what was decided and which requirement got which test. Click Overview, the first entry in the rail, to open it.
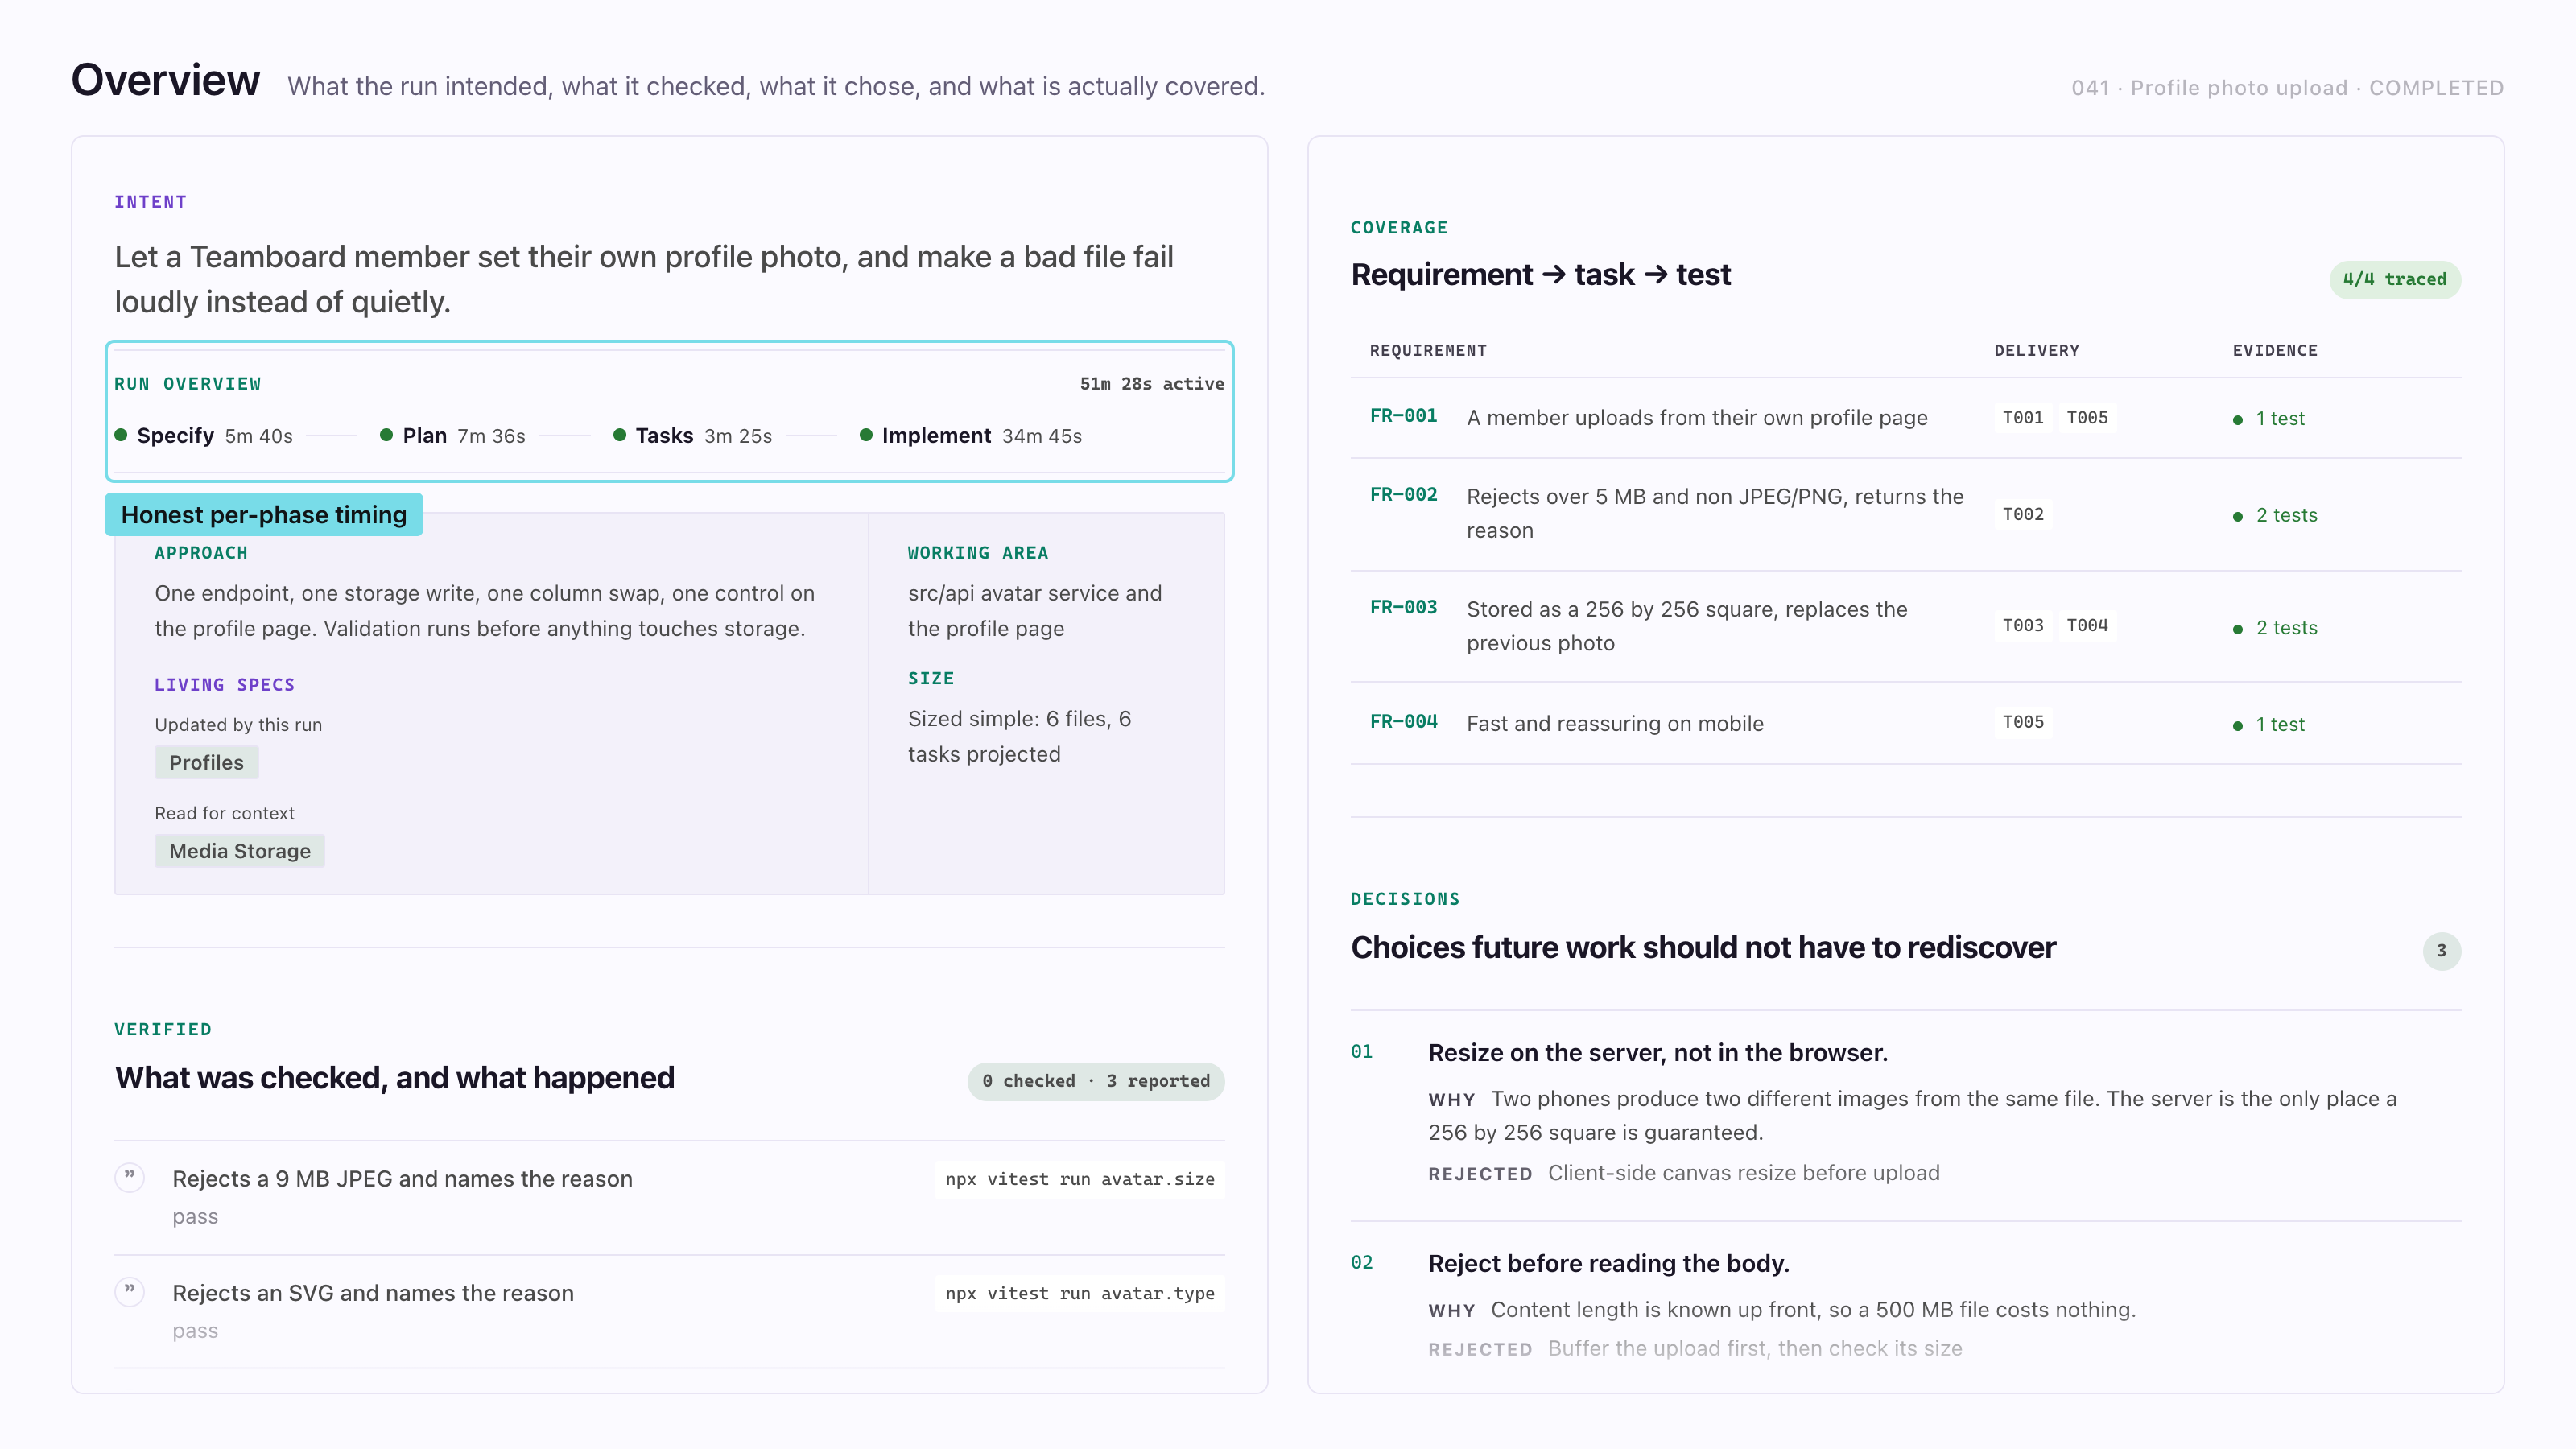
It is read from the run record, a .spec-context.json file next to the spec. Nothing on the page runs or re-checks anything.
When it appears
Section titled “When it appears”| Situation | What you get |
|---|---|
| A feature spec whose run recorded something | The Overview, as the first entry in the rail |
| A spec that was never run | No Overview. The spec opens on its document. A status, a current step or your own review comments do not count as a run. |
| A living spec | Its own overview, not this one |
speckit.viewer.activityPanel set to false |
No Overview |
| The Companion Spec Kit extension is not installed | A thin page and a banner offering the install, because most of what the page reads never gets written |
A region with nothing recorded does not render, so a thin page means a thin record.
The regions
Section titled “The regions”Each region has a title and, on the right, a count. Skim the counts first. They tell you where to read closely.
| Region | What it shows |
|---|---|
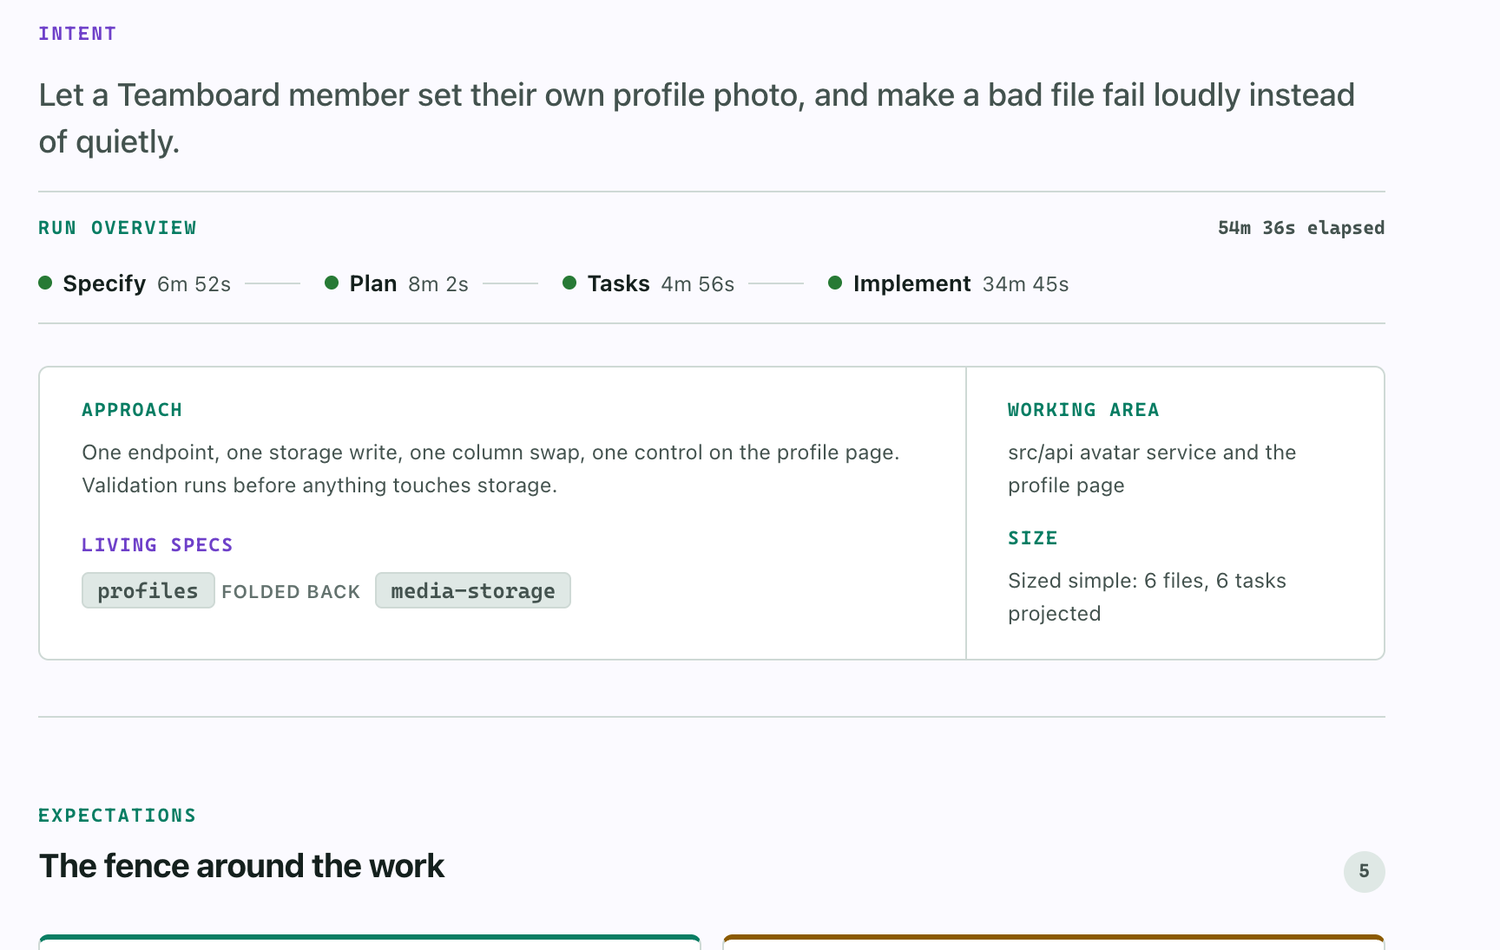
| Intent | The one sentence the run answers to. Beside it: the approach, the working area, a sizing line such as Sized simple: 6 files, 8 tasks projected, and any living specs the run loaded. |
| Run overview | One entry per phase with the time it took, and the run’s total as active time |
| Expectations | Constraints on one side, declared non-goals on the other |
| Verified | Each check with its command and outcome: the ones the recorder ran, then the ones the assistant only reported |
| Decisions | The choice, why, and what was rejected |
| Coverage | Each requirement, the tasks that delivered it and the tests that exercise it |
| Run log | Collapsed: the per-phase timeline, per-task records, concerns, files touched and review comments |
How to read each one
Section titled “How to read each one”Intent. Read it first. If it does not match what you expected, stop there.
Run overview. The total is active time: the time the phases took, without the waits between them.
| A phase reads | Meaning |
|---|---|
| A duration | Both ends of the phase were recorded |
| Blank | One end is missing. The page declines to guess. It is not a zero. |
| “folded into Plan” | The run merged this phase into an earlier one |
| No end yet | The phase is running. Its live timer is on the rail tab. |
When some phases have no time, the head reads “Timing coverage: N of M phases”, or “Timing not recorded”.
Expectations. Something you expected is not in the diff? Check the non-goals before calling it a gap.
Verified. The count reads 3 checked, or 2 checked · 1 reported. A checked row is a command the recorder ran itself, and it keeps the exit code. A reported row, marked with a quote, is the assistant’s own account of something that could not be run, so 0 checked · 5 reported means nothing was run for you. Use the list to learn which commands to run yourself.
Decisions. The first three show and the rest sit behind “Show N more decisions”. The rejected line is the useful part. It is what a later session would otherwise rediscover the slow way.
Coverage. This table most often carries bad news. Untraced requirements sort first, and six rows show before “Show all N requirements”. The count reads 4/7 traced, in a warning tone until every requirement has evidence.
| Evidence reads | Meaning |
|---|---|
| “N tests” | The requirement names N tests, and every file is on disk |
| “No test linked” | The requirement names no test |
| “N tests not found” | It names N tests, and none of the files is on disk |
| “K of N found” | It names N tests, and only K of the files are on disk |
The check is that the file exists. Nothing runs the test.
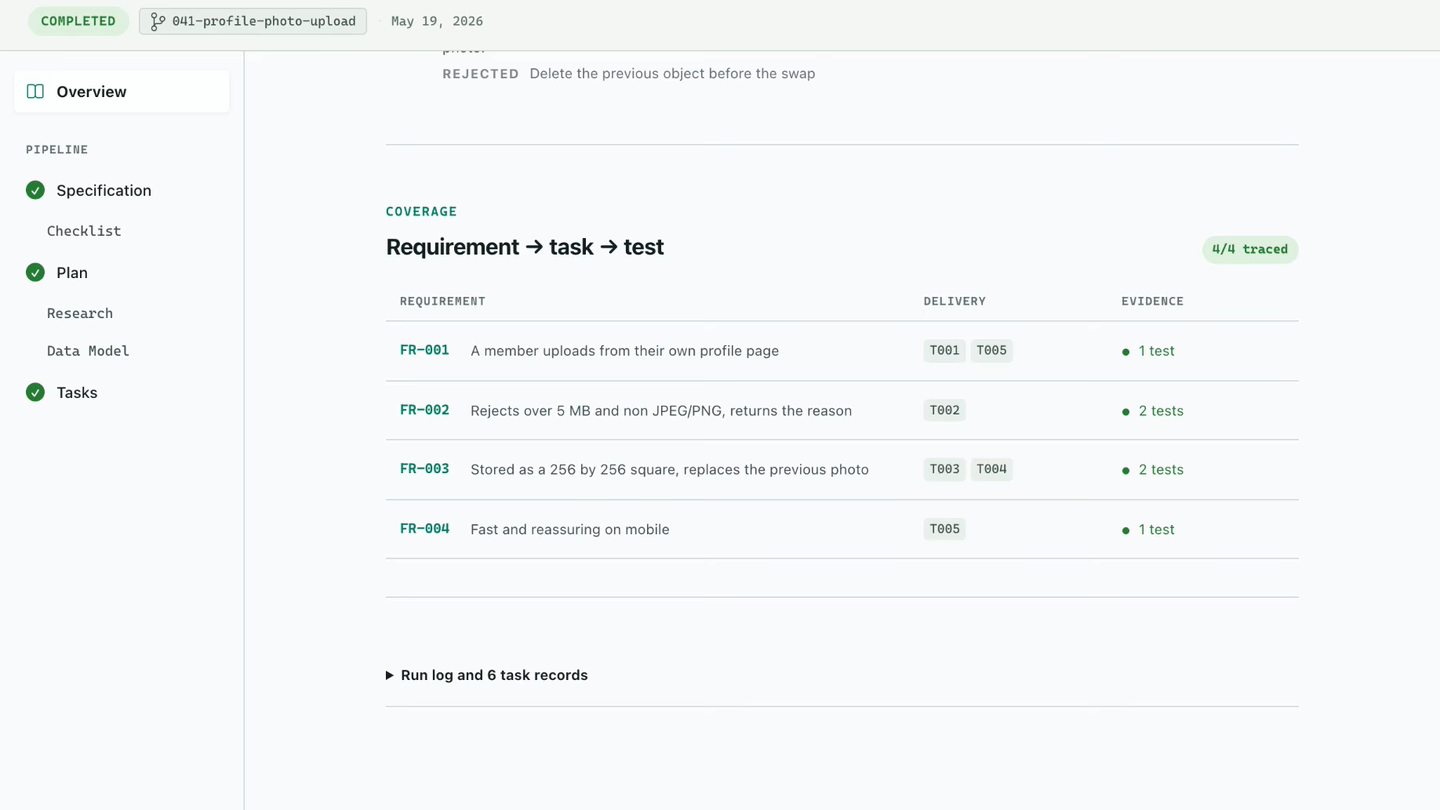
Run log. Open it when you need to know which files a run touched or what one task did.
How far to trust it
Section titled “How far to trust it”- Where it comes from. The Companion Spec Kit extension writes
.spec-context.jsonduring runs, and the VS Code extension only reads it. Commit the file and the record travels with the branch. - Timestamps differ in trust. Step boundaries and per-task finishes are written by a script. Clarify and analyze closes, and the smaller stages inside plan and tasks, are reported by the assistant to the second. The run only says “X active” when specify, plan, tasks and implement all measured cleanly.
- The log only grows. A write that would publish a shorter history is rejected.
- The install banner. Dismiss it once and it stays gone, or set
speckit.companion.installPrompttofalse.
Related
Section titled “Related”- Review with comments is how you say a decision here is wrong.
- Track progress covers the doctor, which checks whether the record itself can be believed.